William_Potter
Investment Thesis
The VanEck Morningstar SMID Moat ETF (BATS:SMOT) launched on October 4, 2022, and, together with the VanEck Morningstar Wide Moat ETF (MOAT), allows investors to own wide and narrow moat companies trading at attractive valuations across all size segments. The concept is simple, as companies with sustainable competitive advantages will likely perform well in the long run. SMOT’s 0.49% expense ratio, which includes a 0.10% waiver, isn’t too much of a deterrent for me because if MOAT is any indication, these fees are worth the superior strategy you get in return.
Today, I will present the results of my research that compares SMOT against several peers in the mid-cap space. Overall, it’s more of a value play than one on quality, and I do have some concerns about momentum and sentiment that I’d like to share with you. For now, I’ve assigned a neutral “hold” rating to SMOT, but I think it will be an exciting fund to watch, and I plan to reassess several times throughout the year as the Index reconstitutes. I hope you enjoy the analysis.
SMOT Overview
Strategy Discussion
SMOT tracks the Morningstar US Small-Mid Cap Moat Focus Index, selecting 75-150 small- and mid-cap securities with wide or narrow moats, as determined by Morningstar analysts. Securities are equal-weighted at each quarterly reconstitution, and, according to the Index Overview, the Index launched on July 25, 2022, with performance backtested to March 18, 2011.
Morningstar
The Index Rulebook describes the selection process in detail. The starting universe is the Morningstar US Small-Mid Cap Index, which currently has 1,147 holdings and targets the 70-97% percentile of the U.S. investable market. Within this Index, only 12.8% (147 holdings) have wide moat coverage, which isn’t enough to create a sub-index of up to 150 holdings. As a solution, the Index also includes narrow moat companies, which adds another 34.9% (400 holdings) to the eligibility list, totaling 547.
The Index combines two sub-portfolios that reconstitute on staggered quarters. Each sub-portfolio targets 75 companies, but companies can qualify for both, which explains why SMOT currently has only 102 holdings. In effect, the Index holds about 20% of the eligible universe selected based on several screens and rules, which I’ve summarized below.
1. All eligible securities must have 12 months of price history, a $5 million three-month average daily trading value, a wide or narrow moat rating, and a fair market value assigned by Morningstar analysts.
2. The bottom 3% by float-adjusted market capitalization are not eligible.
3. The bottom 20% by twelve-month total returns are not eligible.
4. Companies with the lowest current market price / fair value ratios are selected for inclusion in each sub-portfolio.
5. The Index caps sector weights corresponding to its benchmark weight + 10% or 40%, whichever is higher. Since the largest sector in the benchmark Index is Industrials at 17.6%, the sector cap is effectively 40%.
6. Each sub-portfolio reconstitutes quarterly, meaning about half the portfolio is reset each quarter in March, June, September, and December. In addition, each sub-portfolio’s target weight is reset to 50% each June and December.
Assigning Appropriate Benchmarks
We must assign SMOT an appropriate benchmark when assessing relative performance and fundamentals. Based on the above criteria, the bottom 3% by market cap screen excludes only small-cap stocks. It’s also likely that the more established mid-cap stocks would have a fair value assigned by Morningstar analysts. Finally, mid-cap stocks are more likely to have a wide or narrow moat because they are more established. It all adds up to SMOT being primarily a mid-cap fund. That’s how Morningstar classifies it, and it’s just the logical result of its selection process.
Morningstar
We can also analyze SMOT’s current holdings to determine its style. SMOT’s weighted average market cap is $20.34 billion, which is below other mid-cap blend ETFs on the market, including:
- iShares Morningstar Mid-Cap ETF (IMCB): $31.95 billion
- iShares Morningstar Mid-Cap Value ETF (IMCV): $30.45 billion
- iShares Morningstar Mid-Cap Growth ETF (IMCG): $33.35 billion
- iShares Russell Mid-Cap ETF (IWR): $27.59 billion
However, it’s above the $14.50 billion average for the mid-cap blend category, which range between $7.36 billion for the Invesco S&P MidCap Low Volatility ETF (XMLV) and $34.18 billion for the Vanguard Mid Cap ETF (VO). It’s also well above the average for the small-cap blend category, which is between $3.85 and $9.15 billion.
I’ve spent some extra time looking into this to counter assertions I’ve read in other articles, which argue SMOT is best compared against small-cap ETFs or even the SPDR S&P 500 ETF (SPY). In my view, both assertions are incorrect. Mid-cap ETFs like IWR are appropriate benchmarks, and since SMOT includes a value component, it’s also worth evaluating the iShares Russell Mid-Cap Value ETF (IWS), which has a $25.81 billion weighted average market cap.
SMOT Analysis
Sector Exposures and Performance
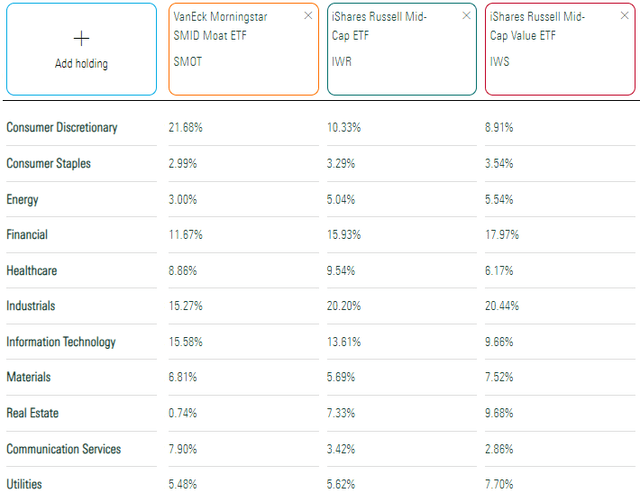
The following table highlights sector exposure differences between SMOT, IWR, and IWS. SMOT overweights Consumer Discretionary by 11-13% but underweights Financials and Industrials by 4-6% and 5%, respectively.
Morningstar
These sector exposures indicate the 40% sector weight cap mentioned earlier won’t apply. Still, it’s reasonably well-diversified for a smart beta fund with about 100 holdings. Naturally, broad-based Index funds provide better diversification, but SMOT is different enough to give a different risk and return profile, and that’s what it’s offered since November 2022.
Portfolio Visualizer
As shown, SMOT has gained 22.48% since November 2022 compared to 22.86% and 19.04% for IWR and IWS. The results are solid, but one thing to watch is volatility. SMOT has realized an annualized 22.24% standard deviation compared to 18.53% and 18.98% for IWR and IWS, and that extra volatility wasn’t necessarily positive. SMOT’s downside risk-adjusted returns (Sortino Ratio) and maximum drawdown figures are worse than IWR.
Fundamentals By Sub-Industry
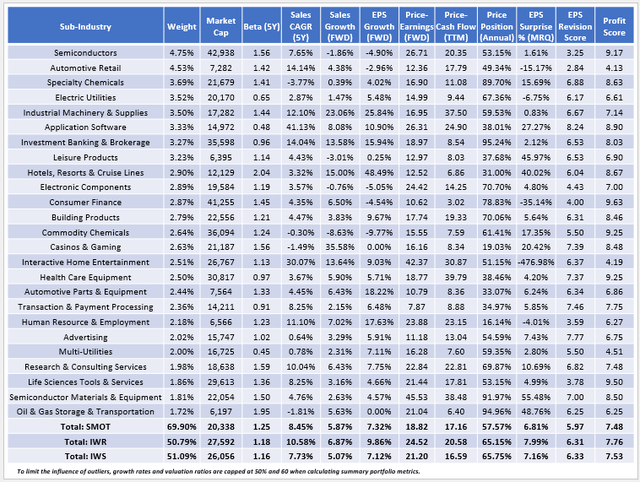
The following table highlights selected fundamental metrics for SMOT’s top 25 sub-industries, totaling 69.93% of the portfolio. I’ve also included summary metrics for IWR and IWS at the bottom.
The Sunday Investor
Here are three observations to consider:
1. SMOT has a 1.25 five-year beta, higher than the 1.18 and 1.16 figures for IWR and IWS. This result supports what we saw earlier in the performance analysis table where SMOT experienced higher volatility. No single sub-industry contributes to this, but SMOT holds twelve stocks across each of the top three sub-industries, with five-year betas as follows:
- Eastman Chemical (EMN): 1.55
- DuPont de Nemours (DD): 1.28
- Asbury Automotive Group (ABG): 1.19
- ON Semiconductor (ON): 1.78
- CarMax (KMX): 1.64
- Lithia Motors (LAD): 1.59
- Skyworks Solutions (SWKS): 1.35
- Marvell Technology (MRVL): 1.47
- NXP Semiconductors (NXPI): 1.55
- Microchip Technology (MCHP): 1.60
- AutoNation (AN): 1.22
- Celanese Corp. (CE): 1.36
The beta differences between IWR and IWS suggest that mid-cap value stocks are less volatile than growth stocks, but SMOT differs. In some ways, it reminds me of deeper-value funds like the Pacer US Small Cap Cash Cows 100 ETF (CALF), but just not as extreme.
2. SMOT trades at 18.82x forward earnings using the simple weighted average method and 15.02x using the harmonic weighted average method, which is close to what you’ll find on Morningstar’s website. As shown below, this is slightly less than the category average and consistent with my independently-calculated statistics.
Morningstar
SMOT’s forward P/E ranks the sixth-cheapest among 37 mid-cap blend ETFs I track. In addition, its 7.66/10 sector-adjusted value score, which I derived using Seeking Alpha Factor Grades, ranks #9/37, and its 57.57% price position statistic confirms the value lean. For those unfamiliar with this statistic, it is the weighted average output of the following:
[Current Price – 52 Week Low] / [52 Week High – 52 Week Low]
Compensation Analysts call this “range penetration” when assessing an employee’s salary relative to their salary band minimum and maximum figures, but there’s no reason we can’t use the same logic for stock prices. SMOT’s 57.57% result, which is the second-lowest in its category, tells me that the strategy, in a nutshell, is to take advantage of short-term mispricings through frequent quarterly reconstitutions. You might call it an “anti-momentum” fund, so it likely won’t ever receive a high Seeking Alpha Quant Score. The system double-weights the momentum factor.
Seeking Alpha
3. When ranking U.S. Equity ETFs, I don’t double-weight the momentum factor. Instead, I double-weight quality, so I was slightly disappointed when SMOT didn’t stand out on this metric. Its 7.48/10 sector-adjusted profit score is still solid and ranks #13/37, but it is worse than IWR’s and IWS’s score and not what you might expect from a portfolio of wide and narrow moat stocks. VanEck’s other moat ETFs also have mixed results, with scores and category rankings as follows:
- VanEck Morningstar Wide Moat ETF (MOAT): 9.08/10 (#133/229)
- VanEck Morningstar ESG Moat ETF (MOTE): 9.08/10 (#136/229)
- VanEck Morningstar Wide Moat Value ETF (MVAL): 9.26/10 (#8/98)
- VanEck Morningstar Wide Moat Growth ETF (MGRO): 8.95/10 (#51/57)
To be sure, SMOT’s quality is not poor. It’s above average, but it’s a mistake to assume wide and narrow moat stocks are more profitable than their peers. Instead, it’s just a different group of stocks that Morningstar analysts perceive as undervalued, and they may be right. Nevertheless, at present, SMOT’s growth and valuation metrics are similar to IWS’s, and if the analysts are wrong, SMOT’s higher volatility indicates worse returns in a drawdown.
Ranking SMOT: It Depends On The Category
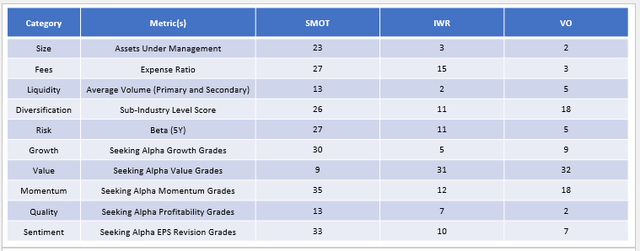
Ranking SMOT based on objective data is important for any ETF analyst because it demonstrates that they’ve considered the alternatives. In the earlier table, I compared SMOT’s fundamentals with IWR and IWS. However, you might have different ETFs in mind, and that’s why I’ve ranked SMOT against its mid-cap peers on ten factors that I believe drive a fund’s success. Let’s start with how SMOT ranks in the mid-cap blend category, which includes 37 ETFs.
The Sunday Investor
Excluding some of the “basic” metrics like size and liquidity, which are more of a function of SMOT’s launch date, SMOT is more value-focused than IWR and VO, two of the most popular mid-cap blend ETFs. However, its quality is weaker, and its #35/37 momentum rank aligns with its #33/37 sentiment rank, indicating that SMOT’s holdings are priced poorly because consensus analyst estimates are declining. Maybe Morningstar analysts know something the rest of Wall Street doesn’t, but that’s the bet.
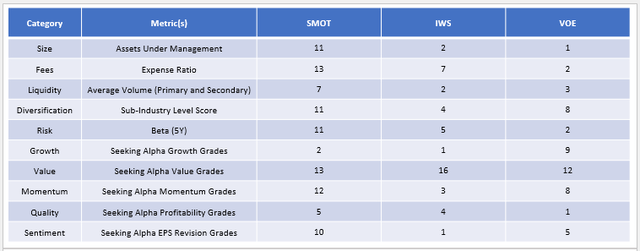
The following table is more relevant if you consider SMOT a mid-cap value fund. Including SMOT, I track 16 ETFs in this category, and I’ve included its rankings alongside IWS and the Vanguard Mid-Cap Value ETF (VOE) below.
The Sunday Investor
Here, we see SMOT scores worse on value but better on growth, so maybe “value-light” is its best description. Quality is also solid, but in a value rotation or a market drawdown, VOE looks better.
Investment Recommendation
SMOT could turn out to be an excellent fund, but I’m unsure the moat strategy transfers well to small- and mid-caps, mainly since its Index includes narrow moat companies that aren’t much more profitable than its peers. Instead, its success will hinge on the accuracy of Morningstar’s fair value estimates. My analysis revealed its current holdings trade closer to their 52-week low prices than nearly every other mid-cap blend ETF, and its 15.02x forward P/E indicates it’s a solid value play.
However, the catch is that Wall Street analysts recently downgraded earnings expectations for many holdings, suggesting they’re priced poorly for a good reason. In this sense, Morningstar analysts have taken a contrarian view, and before deciding if they’re skilled enough with this size segment, we need more evidence. Therefore, I have assigned a neutral “hold” rating to SMOT, and I look forward to following the fund closer with each quarterly reconstitution. Thank you for reading.
