Luis Alvarez
Originally published on July 12, 2024
Most people who casually follow the financial markets, watch the news, or read online have probably seen some variation of this headline.

You may have heard people on TV talk about how great “the stock market” is performing and assume that it’s true. The reality is that it’s only true for a few narrow segments of “the market.”
There are very few markets – and just a small portion of stocks – that are doing really well. This has implications for the performance of diversified portfolios and relative returns of active investment managers.
Note that all figures are through June 30, 2024.
Large Companies and Smaller Companies
Indexes of large and smaller publicly traded US companies are commonly called Large Caps (represented by the S&P 500 index) and Small Caps (represented by the Russell 2000 index), respectively.
These indexes are “cap-weighted”. Cap-weighted means the stocks in the index are proportional to their market value, or market cap. A stock’s market cap is equal to its price per share multiplied by the total number of shares outstanding.
Let’s look at the longer-term context first and then review recent performance.
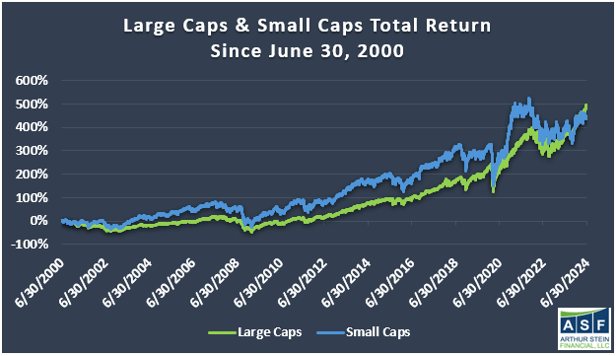
Over a long period of time – since 2000 – Large Caps and Small Caps have performed relatively similarly. Large Caps outperformed, but not by a drastic amount.
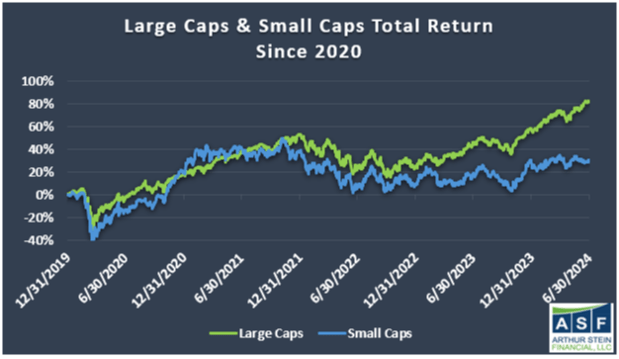
However, a divergence in Large Cap and Small Cap performance began around the Covid period. Since 2020, Large Caps outperformed Small Caps by over 50%.
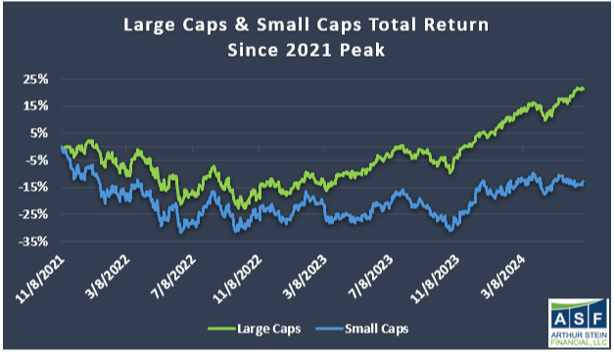
Small Caps peaked in November 2021, but then declined and have not recovered. This marked an end to a euphoric market spurred by extremely easy monetary and fiscal policy coupled with pent-up demand coming out of peak Covid lockdowns. Large Caps hit a cycle high shortly thereafter but have made several new all-time highs since.
Since that Small Cap peak, Large Caps have advanced by about 21% while Small Caps are still down by about 13%: an outperformance of 34% by the Large Caps.
This year has not been much different, with Small Caps about flat and Large Caps up 15%.
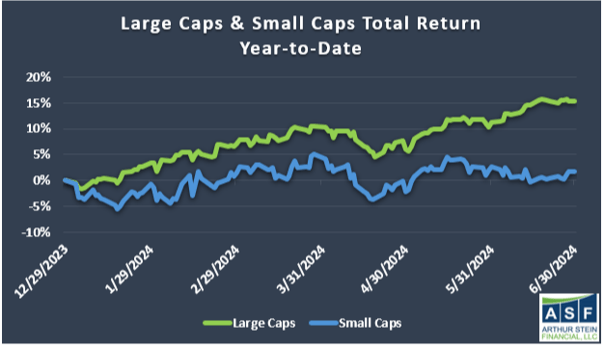
While stocks of large US companies have done well over the last few years, stocks of small US companies are negative. This is the first indication that not all markets are strong.
Divergence Within the S&P 500 and Weakness Below the Surface
The indexes mentioned above are market cap weighted, meaning stocks are weighted in order of their market value. A useful way to see how the broader market is doing is to look at the S&P 500 Equal-Weight index.
The S&P 500 Equal-Weight index contains the same stocks as the S&P 500 but holds each stock in the same weight (about 0.20% of the index per stock). It effectively neutralizes the dominance of the largest stocks.
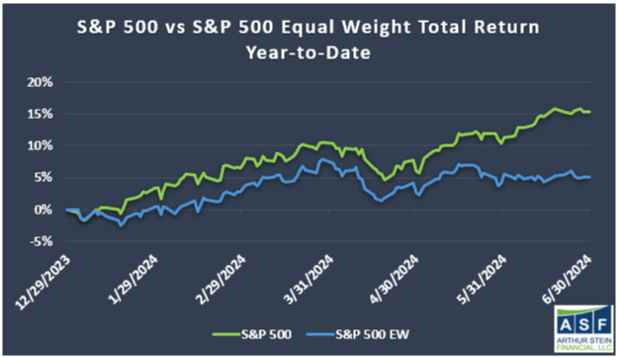
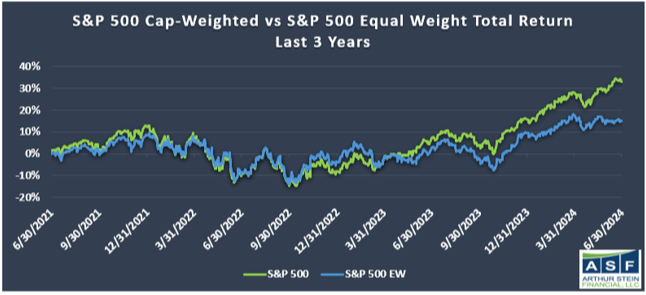
The charts below show the relative performance between the cap-weighted and equal-weighted versions of the S&P 500 year-to-date and over the last three years.
Year-to-date, the cap-weighted S&P 500 has returned 3 times the return of the S&P 500 Equal-Weight.
Perhaps more notable is that the S&P 500 Equal-Weight index has returned 15% in total over the last three years – about 5% per year. A 5% annual return is less than an investor could receive on numerous high-quality bonds today. And these lackluster returns occurred during a period when markets are supposedly strong.
Finally, there has been a major divergence in performance between S&P 500 Growth stocks and S&P 500 Value stocks.
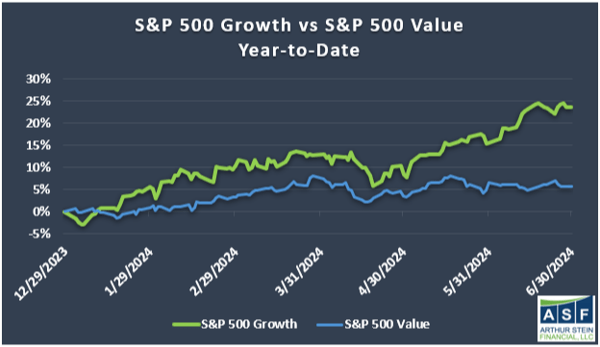
This is the second indication that different types of stocks are not doing equally well: The S&P 500 cap-weighted index significantly outperformed the equal-weighted S&P 500 index and growth stocks outperformed value stocks.
Narrow Leadership
Drilling down one more level, we can see that the S&P 500’s returns are largely driven by a handful of stocks – meaning that the S&P 500 is experiencing narrow leadership at the stock level.
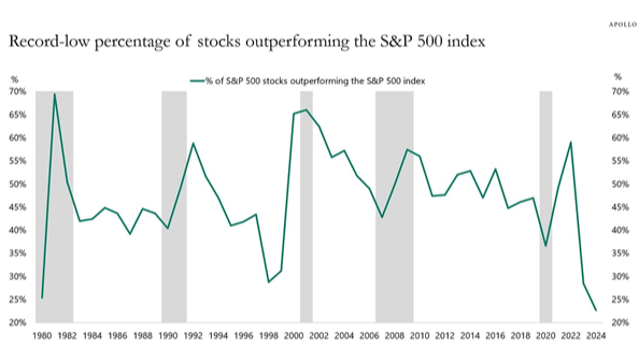
The charts below show that the so-called Magnificent 7 stocks (Alphabet, Amazon, Apple, Meta, Microsoft, Nvidia, and Tesla) and a few others:
1) have driven the majority of the index’s returns,
2) significantly outperformed the other stocks in the Index, and
3) comprise a larger and larger percentage of the market value of the index.
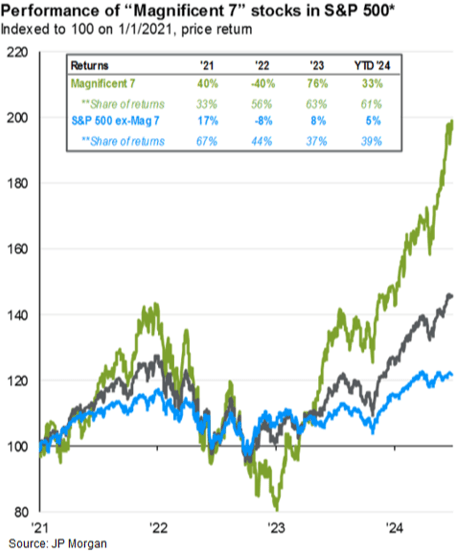
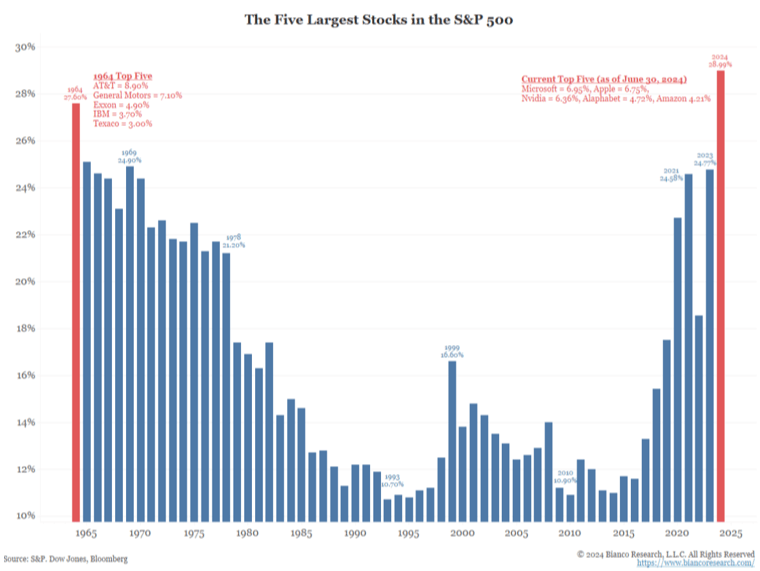
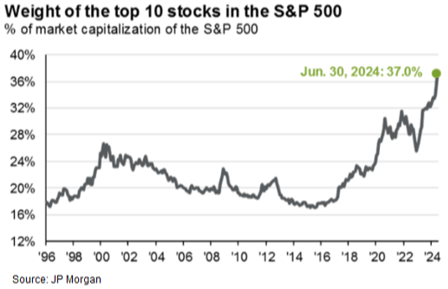
This has led to narrow leadership at the sector level as well.
Year-to-date, only two sectors in the S&P 500 have outperformed the overall index: communications services (Meta and Google) and technology (Microsoft, Nvidia, Apple, etc). It should not be surprising that most of the top 10 best performing stocks reside in these two sectors.
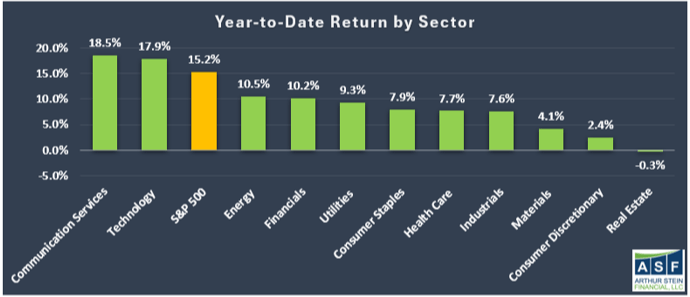
This is the third indication that many types of stocks are underperforming.
Other Markets
US Bonds and stocks of foreign companies are also underperforming the S&P 500.
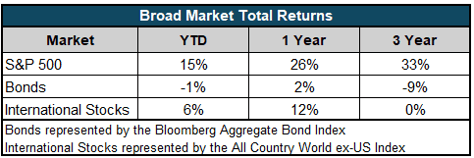
Bonds are down 9% over the past three years due to the swift and steady rise in interest rates. International stocks are flat over the same period. These returns are not just poor relative to the S&P 500 but are abysmal on a standalone basis.
This is the fourth indication that a few stocks in the S&P 500 have outperformed virtually everything else.
Conclusion
Although the S&P 500 and a subset of stocks within the S&P 500 have done well, a deeper look within the index and across asset classes shows that most of the market performance has been driven by a small number of stocks. Small Cap stocks, most S&P 500 stocks, Bonds, and International Stocks have not performed nearly as well as the S&P 500.
How does this affect you?
Well-managed Portfolios own assets that have historically performed differently at different times (correlation <1) to reduce the likelihood that all assets in the Portfolio perform poorly at the same time. While we certainly like to see the S&P 500 performing well (and it has), it is important to remember that there are many investment markets.
As a result, returns of diversified Portfolios are not delivering a performance anywhere close to the strong performance often seen in headlines because these other asset classes have not kept up with the S&P 500.
This is not a reason to not be diversified. Instead, it is important to acknowledge that there has been weakness in many stocks, stock markets, and Bond markets and realize that strong investment performance has been narrow for some time.
Original Post
Editor’s Note: The summary bullets for this article were chosen by Seeking Alpha editors.
