honglouwawa
By Sue Lee
Over the years, the accumulation of assets and trading volumes across index-linked products such as futures, options and exchange-traded funds (ETFs) has led to a trading ecosystem associated with major market indices. Index arbitrageurs and market makers trade different products tracking the same index, keeping their prices sufficiently close to the underlying index. Other market participants use these products interchangeably to obtain or adjust their exposure. All these trading activities support pricing and liquidity, fostering market efficiency and transparency.
A robust index trading ecosystem benefits frequent traders by allowing them to trade related index-linked products with relatively lower cost, including bid-ask spread and market impact, and in relatively larger size. Long-term passive investors also benefit from an assurance in the value of their investment throughout their investment horizon; investors enter the trade at a price close to fair value, monitor the value of their holding in real time, and may have reasonable confidence to exit at near fair value.
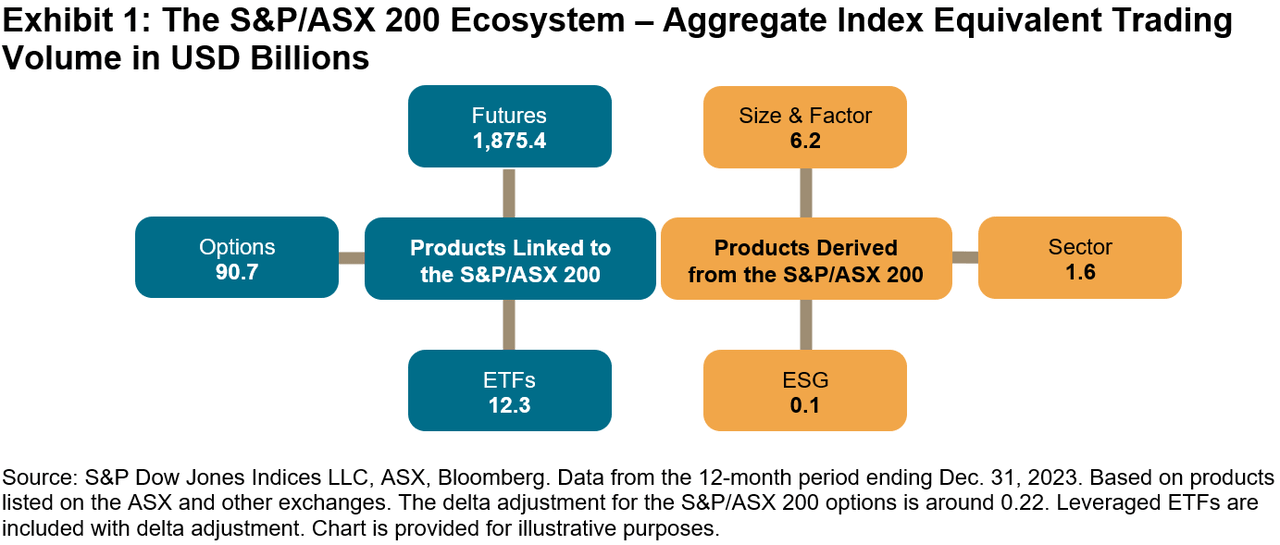
Among the tradeable indices produced by S&P Dow Jones Indices, the S&P/ASX Index Series has the third-largest trading volume, after the S&P 500® and the Dow Jones Industrial Average®. Its aggregate traded economic value1 in 2023 exceeded USD 1.9 trillion, largely driven by the futures contracts of the S&P/ASX 200, a preeminent Australian benchmark index (see Exhibit 1). Its total indexed assets were estimated at USD 102 billion at the end of 2023.2 Since its debut in 2000, the S&P/ASX Index Series has served as the barometer of the Australian stock market and become an integral part of the country’s market infrastructure.

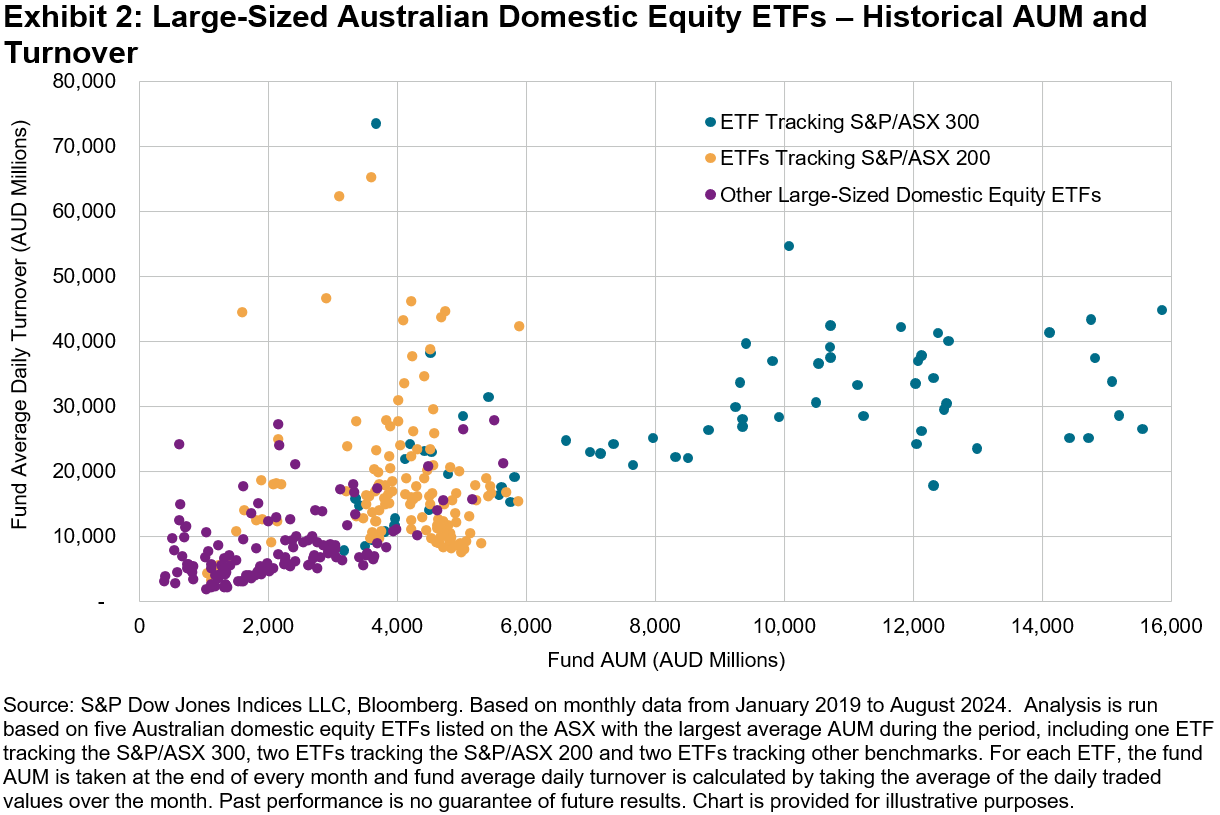
Australian ETFs are a good example of the benefits of an index trading ecosystem. Exhibit 2 shows the historical turnover and assets under management (AUM) of the five largest Australian domestic equity ETFs listed on the ASX. Fund AUM and turnover display a positive relationship in general, with the ETFs tracking the S&P/ASX 300 having the highest AUM and turnover most of the time. More interestingly, given a similar level of fund AUM, ETFs tracking the S&P/ASX 200 tended to have higher turnover than the three ETFs tracking other indices.

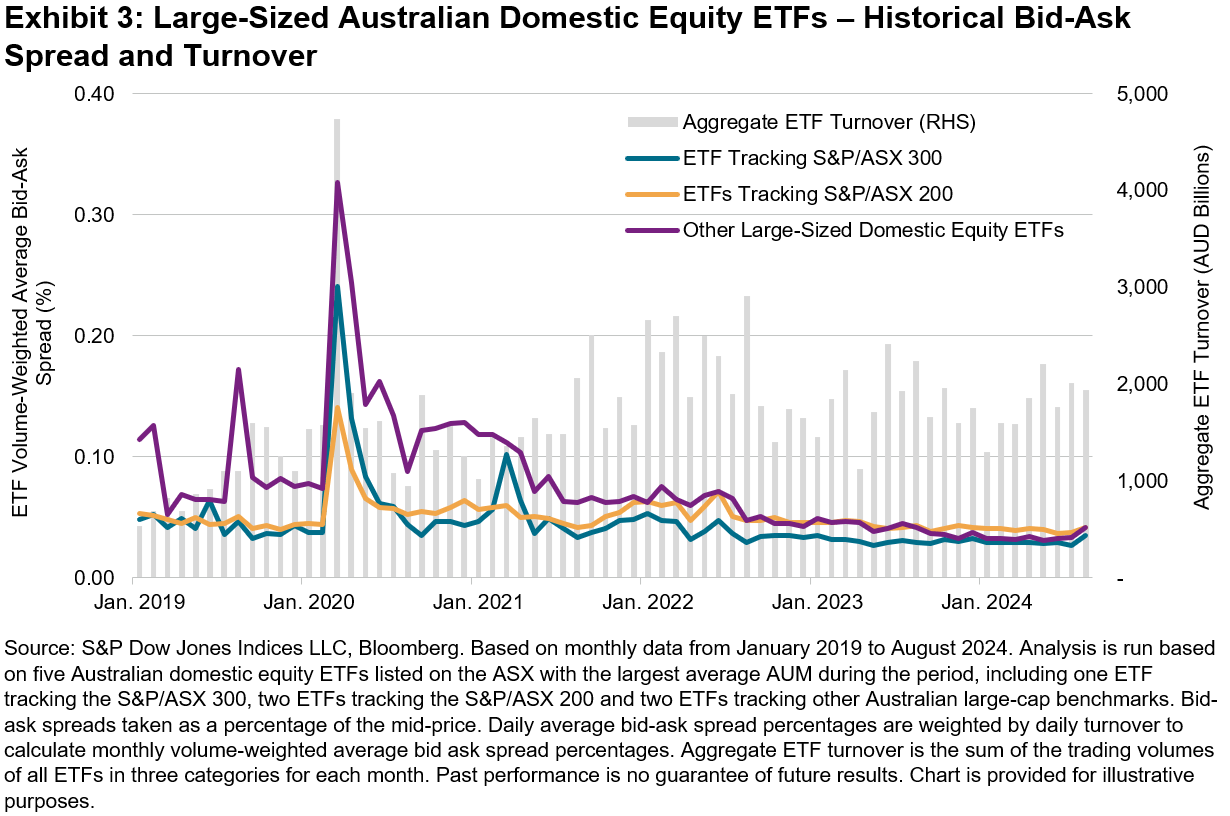
Higher trading volumes often contribute to lower trading costs, which is shown in the historical bid-ask spread levels of these ETFs in Exhibit 3. While the S&P/ASX 300 ETF usually had the tightest spreads, ETFs in all three categories traded in a stable bid-ask spread range of 3-5 bps since 2023. March 2020 to May 2020 stands out as an exception – when market volatility spiked along with turnover, the S&P/ASX 200 ETFs maintained notably lower bid-ask spreads than ETFs in the other two categories. The benefit of a large and active trading ecosystem comes to the fore when market moves amplify and the need for trading increases.

A recent episode on Aug. 5, 2024 reminded us of this again, as the S&P/ASX 200 ETF bid-ask spread remained most stable during a day characterized by a 3.7% market sell-off and the S&P/ASX 200 VIX soaring from 12 to 19. Both issuers and users of index-based products may want to consider underlying index liquidity when designing or choosing a product.
1 Traded economic value is measured by Index Equivalent Trading Volume, a notion developed by S&P Dow Jones Indices to reflect the economic exposure to the index that is being transacted at the time a trade occurs. It is determined by the instrument’s short-term responsiveness to movements in the underlying index (i.e., adjusted by the delta of the instrument). For details, please see Edwards, Tim, “A Window on Index Liquidity: Volumes Linked to S&P DJI Indices,” S&P Dow Jones Indices LLC, August 2019.
2 Indexed assets are assets in and/or notional value of institutional funds, ETFs, retail mutual funds, exchange-traded derivatives and other investable products that seek to replicate or capture the performance of the S&P/ASX Index Series. See Annual Survey of Assets as of December 31, 2023, S&P Dow Jones Indices LLC.
Disclosure: Copyright © 2024 S&P Dow Jones Indices LLC, a division of S&P Global. All rights reserved. This material is reproduced with the prior written consent of S&P DJI. For more information on S&P DJI, please visit S&P Dow Jones Indices. For full terms of use and disclosures, please visit www.spdji.com/terms-of-use.
Original Post
Editor’s Note: The summary bullets for this article were chosen by Seeking Alpha editors.
