RoJDesign/iStock via Getty Images
DUSA strategy
Davis Select U.S. Equity ETF (DUSA) is an actively managed ETF launched on 1/11/2017 and seeks to outperform the S&P 500 index (SP500). DUSA has a portfolio of only 26 companies and an expense ratio of 0.61%.
As described in the prospectus by Davis ETFs, the fund focuses on companies with
“proven management, a durable franchise and business model, and sustainable competitive advantages. Davis Advisors aims to invest in such businesses when they are trading at discounts to their intrinsic worth. Davis Advisors emphasizes individual stock selection and believes that the ability to evaluate management is critical. Davis Advisors routinely visits managers at their places of business in order to gain insight into the relative value of different businesses”. A company’s intrinsic value is evaluated “based upon fundamental analysis of cash flows, assets and liabilities, and other criteria that Davis Advisors deems to be material on a company-by-company basis.”
DUSA generally holds 15 to 35 companies. The portfolio turnover rate in the most recent fiscal year was 18%. This article will use as a benchmark the S&P 500 index, represented by SPDR® S&P 500 ETF Trust (SPY).
Portfolio
About 60% of asset value is invested in large and mega-cap companies. The portfolio is overweight in financials (37% of assets). Then, come healthcare (17.1%), communication services (16.9%) and consumer discretionary (12.4%). Other sectors are below 9%. Compared to the benchmark, DUSA massively overweights financials and underweights technology.
DUSA sector breakdown (Chart: author; data: Davis ETFs, SSGA)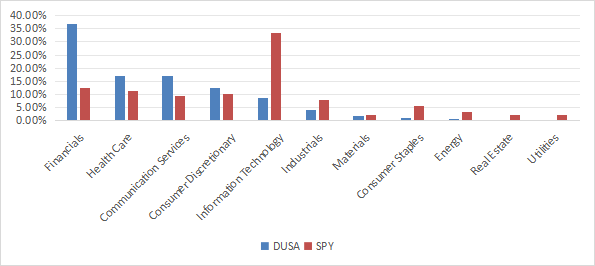
The fund is very concentrated: the top 10 issuers, listed in the next table, represent 64.9% of asset value. The four heaviest positions have an aggregate weight of 37%.
|
Ticker |
Name |
Last |
EPS growth %TTM |
P/E TTM |
P/E fwd |
Yield% |
|
META |
Meta Platforms, Inc. |
11.44 |
115.95 |
30.44 |
26.20 |
0.38 |
|
BRK.B |
Berkshire Hathaway, Inc. |
9.01 |
876.68 |
12.12 |
21.63 |
0 |
|
COF |
Capital One Financial Corp. |
8.65 |
-11.96 |
10.73 |
10.39 |
1.75 |
|
AMZN |
Amazon.com, Inc. |
7.94 |
763.59 |
55.98 |
43.46 |
0 |
|
HUM |
Humana, Inc. |
5.16 |
-34.70 |
23.24 |
22.78 |
0.95 |
|
GOOG |
Alphabet, Inc. |
5.03 |
45.00 |
28.98 |
25.03 |
0.42 |
|
AMAT |
Applied Materials, Inc. |
4.86 |
14.78 |
28.90 |
29.92 |
0.64 |
|
MKL |
Markel Group, Inc. |
4.51 |
797.57 |
8.39 |
18.36 |
0 |
|
MGM |
MGM Resorts International |
4.17 |
-44.44 |
16.81 |
15.84 |
0 |
|
WFC |
Wells Fargo & Co. |
4.17 |
36.90 |
12.49 |
11.78 |
2.34 |
Fundamentals
DUSA is significantly cheaper than the benchmark regarding valuation, as reported in the next table. It has lower earnings and cash flow growth rates, while sales growth is a bit higher. However, aggregate metrics are biased by the heavy weight of financials, where valuation ratios are lower and less reliable than in other sectors.
|
DUSA |
SPY |
|
|
P/E TTM |
16.61 |
26.53 |
|
Price/Book |
1.89 |
4.63 |
|
Price/Sales |
1.49 |
3.02 |
|
Price/Cash Flow |
10.99 |
18.13 |
|
Earnings growth |
19.16% |
23.24% |
|
Sales growth % |
11.06% |
8.80% |
|
Cash flow growth % |
3.23% |
8.94% |
Data source: Fidelity.
In my ETF reviews, risky stocks are companies with at least two red flags among: bad Piotroski score, negative ROA, unsustainable payout ratio, bad or dubious Altman Z-score, excluding financials and real estate where these metrics are unreliable. With this assumption, risky stocks weigh 12.2% of asset value, which is acceptable. Additionally, according to my calculation of aggregate quality metrics (reported in the next table), portfolio quality is slightly superior to the benchmark.
|
DUSA |
SPY |
|
|
Altman Z-score |
4.76 |
3.75 |
|
Piotroski F-score |
5.92 |
6.00 |
|
ROA % TTM |
8.01 |
7.26 |
Performance
Since inception in January 2017, DUSA has lagged SPY by 51% in total return (about 6% annualized).
DUSA vs SPY, since 1/12/2017 (Seeking Alpha)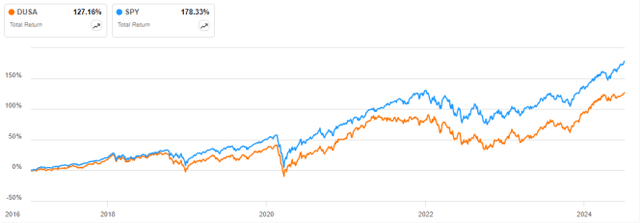
However, it has outperformed the benchmark by almost 4% over the last 12 months:
DUSA vs SPY, 12-month return (Seeking Alpha)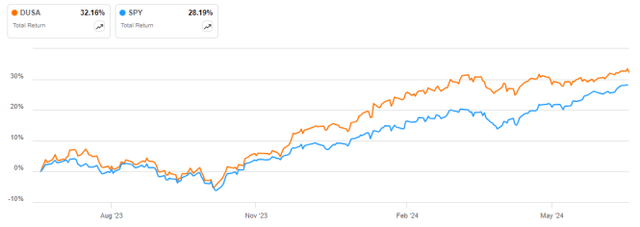
DUSA vs. passive investing styles
The next table compares characteristics of DUSA and three popular passively managed ETFs implementing different investing styles in large companies:
- iShares S&P 500 Value ETF (IVE)
- SPDR Portfolio S&P 500 Growth ETF (SPYG)
- Invesco S&P 500 Quality ETF (SPHQ).
|
DUSA |
IVE |
SPYG |
SPHQ |
|
|
Inception |
1/11/2017 |
5/22/2000 |
9/25/2000 |
12/6/2005 |
|
Expense Ratio |
0.61% |
0.18% |
0.04% |
0.15% |
|
AUM |
$521.03M |
$32.77B |
$30.05B |
$10.12B |
|
Avg Daily Volume |
$1.09M |
$92.26M |
$212.51M |
$56.50M |
|
Number of Holdings |
26 |
443 |
232 |
103 |
|
Assets in Top 10 |
64.90% |
19.44% |
60.85% |
45.96% |
|
Turnover |
18.00% |
32.00% |
33.00% |
65.00% |
DUSA has the highest expense ratio of this list, the most concentrated portfolio, and the lowest turnover.
The next chart plots total returns since 1/12/2017. DUSA is far behind the growth and quality ETFs, but it beats the value fund.
DUSA vs passive style ETFs, since 1/12/2017 (Seeking Alpha)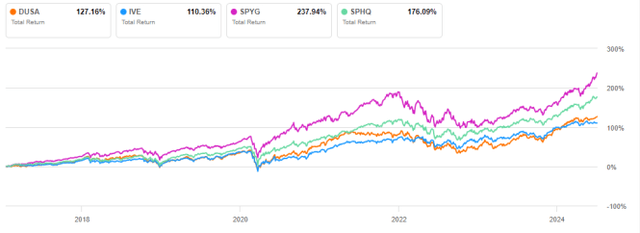
Nonetheless, DUSA is the second-best performer over the last 12 months, shortly ahead of SPHQ:
DUSA vs passive style ETFs, 12-month return (Seeking Alpha)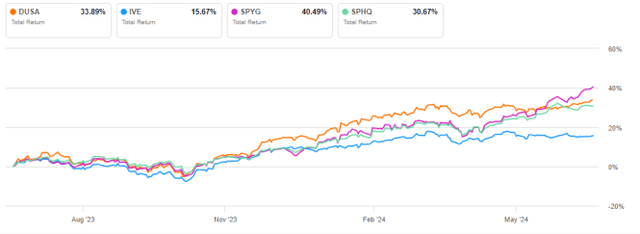
Takeaway
Davis Select U.S. Equity ETF (BATS:DUSA) is an actively managed ETF with a portfolio of 26 large and mid-cap stocks based on discretionary analysis. DUSA is very concentrated in its top holdings and overweight in financials, making aggregate fundamental metrics quite unreliable. DUSA has missed its objective of outperforming the S&P 500 index over its 7 years of existence. It has also lagged popular passively managed ETF in growth and quality styles. DUSA track record is unconvincing and results don’t justify its high expense ratio.
Editor’s Note: This article discusses one or more securities that do not trade on a major U.S. exchange. Please be aware of the risks associated with these stocks.
