Richard Drury
With Tesla’s, Inc. stock (NASDAQ:TSLA) (NEOE:TSLA:CA) at a critical juncture, it’s time to look at technical signals that suggest challenges ahead. The high volatility of TSAL suggests major indecision around essential price levels, which this article is analyzing. With the most critical changes in the US monetary policy ahead, investors must set up a contingency plan and be prepared for multiple outcomes. In this article, I discuss strategies to navigate both a continuation or an inversion of the downtrend by offering a solid contingency plan and discussing the risks and opportunities on both sides.
A Macro Perspective
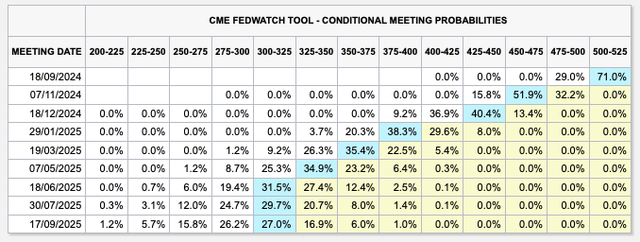
While the US financial sector shines as the strongest performer, the technology sector has performed stellarly in the current year. Still, some cracks have come up in the past few weeks, underscoring the sector’s dependence on a few companies’ market value, which could lead to a correction, as the markets have gladly bought stocks related to the secular trend in AI and its applications, but some valuations could be overextended. With a 71% likelihood of seeing the FED lowering the interest rates by 0.25% and 29% even lowering further by 0.50% in the upcoming FOMC meeting on September 18, many investors are positioning themselves for a possible rally in equities. But the markets are priced for three rate cuts, one at each FOMC meeting until the end of the year by up to 1.50%, leading the rates down to 4% for the lowest estimation, which could disappoint many investors as it would signify that the underlying economic conditions have worsened significantly. At the same time, inflationary pressure would have to improve to justify loosening financial conditions without seeing a spike in inflation.
CME Group FedWatch
According to the latest statistics, 429 tech companies have already laid off over 135’000 employees this year, with August increasing after the downtrend observed in the earlier summer months. Tesla is estimated to have laid off about 14% of its workforce, which would place the company at the top of the list of the largest layoffs in the current year, even ahead of Intel, which announced a massive layoff of 15’000 employees on August 1. The US auto manufacturers have suffered significant losses over the past year, while some encouraging signs of recovery have been observed in the past weeks. A closer look at the industry benchmark will give an overview of the actual situation.
finviz
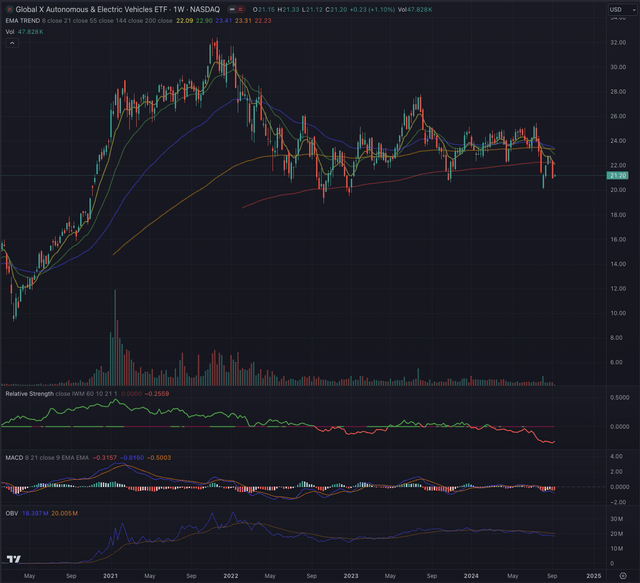
The Global X Autonomous & Electric Vehicles ETF (DRIV) after an extended sideways movement, supported by its 200-days Exponential Moving Average [EMA], has broken below its support, tested it, and is now heading downwards. This trend is confirmed by the weak relative strength reading, compared to the broader stock market represented by the iShares Russell 2000 ETF (IWM), and the negatively trending Moving Average Convergence Divergence [MACD] indicator. The On Balance Volume [OBV] indicator, hints at a possible negative cycle, as it is trending below its 21-days moving average after inverting since the beginning of 2024.
Author, using TradingView
Where are we now?
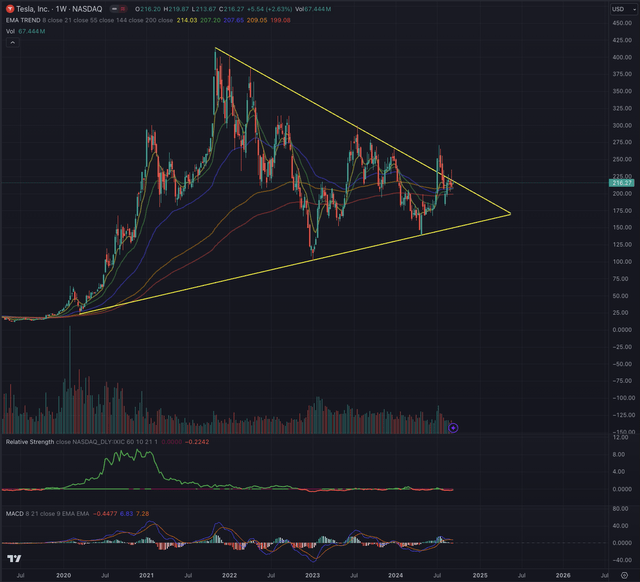
Looking at the big picture, TSLA has formed a massive triangle formation that started from the pandemic low and peaked in November 2021, from where it then continued in its waves-sequence, until breaking out from the converging pattern in July 2024. This type of triangle formation typically extends over 3, 5 or 7 waves, rarely even forming 9 swings before breaking out or down, and defining a new trend. TSLA has tested the breakout while temporarily falling back into the triangle, breaking out for a second time, and is now fighting to stay above the descending trendline. However, it is not uncommon for a breakout or a breakdown to fail, and the price will trend in the opposite direction. The last weekly bar shows quite a lot of selling pressure, which could hint at a reversal from the actual highs.
Author, using TradingView
On its weekly chart, TSLA is holding above its long-term EMA200, while the stock has shown in the past to break through that support level without much hesitation. The stock is underperforming the technology benchmark, represented by the Nasdaq Composite (IXIC), or, more narrowly, the Nasdaq-100 tracked by the Invesco QQQ ETF (QQQ), and its momentum seems to be stalling, as observed in the reverting and flattening MACD.
From this weekly chart, it is unclear if the recent breakout could be considered as determinant for further upside potential, or if the stock will do the opposite and trend lower. For a deeper look into TSLA’s technicals, I will now observe the daily chart, where I can better evaluate the stock’s dynamics and determine whether its current path is sustainable.
What is coming next?
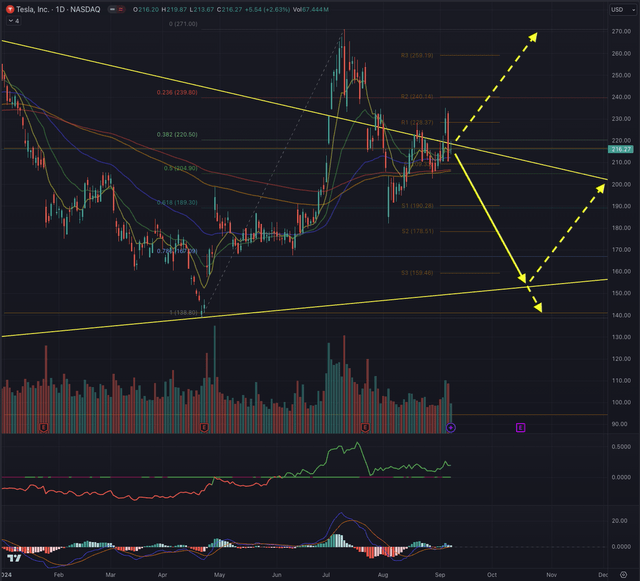
TSLA dropped below the yearly pivot point at $216.53, a significant support and resistance area. This move came with a substantial increase in selling volume and the massive outside bar formed a bearish engulfing, hinting at more downside ahead.
Author, using TradingView
The price is at the monthly pivot point, standing at $216.53 and above the daily 200-day EMA, which could offer some support if the magnitude of the selling pressure isn’t too high. At this point, I consider two scenarios in my contingency plan, with the first one being the base case and the second being the alternative scenario in case the first would fail to materialize.
In the first scenario, TSLA falls back under major support levels between $206 and $209 and drops further towards the lower end of the triangle, leading the stock to fill the massive gap open between $157.51 and $147.26, likely until reaching the area between $144 and $141. This would mean that the price breaks down from its triangle formation, and if the breakdown is confirmed, the next supportive area would be around $102 and $94. The latter being an extreme case, TSLA would first face some support on the way down at $190, $178, and $159. The important part here would be to confirm or reject an important price level support by observing the volume. High volume is needed to break under significant support levels, especially in a stock like TSLA, which has a large community of retail investors for a company of the size of Tesla, also due to its charismatic leader Elon Musk. This usually leads to higher volatility, as retail investors trade more often than institutions, which accumulate and distribute positions more slowly.
Failure to follow these assumptions, brings us to the second scenario, where TSLA could definitely confirm the breakout from the triangle and continue its ascension. Here, overhead targets are set at $228, $240, and $259, if the stock manages to break out from the latest peak at $271, then $292 becomes relevant. This second scenario would need a lot of support from institutions who buy the stock at these levels in the perspective of future gains. A failure of the first scenario and therefore this scenario becoming relevant would happen if TSLA manages to stay out of the triangle formation and consistently overcomes the recent high at $235.
How do we trade the actual situation? Long term shareholders might be interested to defend their profits while staying invested unless the stock would collapse. To do so, stop-loss orders could be set below $175 or even further below the ascending trendline of the triangle formation. On the other hand, short-term traders who might sit on decent profits could take profit here and wait on the sidelines until TSLA has decided where the mid-term trend is heading. I would not enter new positions at this point, but wait for either a confirmation of the breakout as described in scenario two, or wait and see what happens if the stock breaks down further, where it could offer better entry opportunities.
TSLA remains a highly volatile stock, offering great swing trading opportunities and leading to uncertainties. This will most likely not change anytime soon, so investors should buckle on the seat belt and stick to their contingency plan. All considered, the stock is a sell at this point, as the dowards scenario seems more likely, also considering the industry index and the overall stretched US market situation.
The bottom line
Technical analysis isn’t an absolute predictor, but a tool to enhance investors’ chances of success by offering market direction, entry and exit points. As you wouldn’t begin a journey without a map or GPS, investors can use technical analysis to guide their decisions. I apply techniques rooted in Elliott Wave Theory and Fibonacci principles to evaluate potential outcomes and probabilities over time. By validating likely scenarios with these methods, I identify optimal stock entry and exit points after considering price action, sector, and industry trends. My goal is to provide a thorough stock analysis, helping investors make informed decisions and confidently navigate the market.
In conclusion, while Tesla’s stock presents bullish and bearish potential, the current market conditions and technical indicators suggest a higher likelihood of a downward trend. With key support levels being tested and broader market factors pointing to uncertainty, cautious investors may prefer to hold off on new positions or lock in profits while awaiting more precise signals on the stock’s midterm direction. Given the volatility and potential risks, Tesla is a sell in the near term.
