marchmeena29
Investment Thesis
iShares S&P 500 Value ETF (NYSEARCA:IVE) warrants a buy rating due to several relative strengths compared to the overall S&P 500 Index. While IVE has lagged behind the broader market since roughly 2008, value stocks categorically have a strong historical record of performance compared to growth. Additionally, relatively weak performance for value has driven an attractive valuation for IVE compared to broader S&P 500 funds.
Fund Overview and Compared ETFs
IVE is a passive ETF that seeks to track large-cap U.S. companies within the S&P 500 that exhibit value characteristics. iShares defines “value” as a holding’s comparative valuation relative to similar companies. With its inception in 2000, the fund has 438 holdings and $32.7B in AUM. By sector, IVE is heaviest on financials (22.77% weight), followed by health care (18.06%) and industrials (11.36%).
For comparison purposes, other funds examined are Vanguard S&P 500 Value Index Fund ETF Shares (VOOV), SPDR® Portfolio S&P 500 Value ETF (SPYV), and iShares Core S&P 500 ETF (IVV). VOOV and SPYV are very similar to IVE in that they have over 400 holdings within the S&P 500 Index. These value funds also include a low weight on information technology at less than 8.5% weight. IVV was included to show the comparison with the broader S&P 500. As a result, IVV’s weight on technology is significantly greater than all other funds at 32.7% weight.
Fund Comparison: Performance, Fees, and Dividends
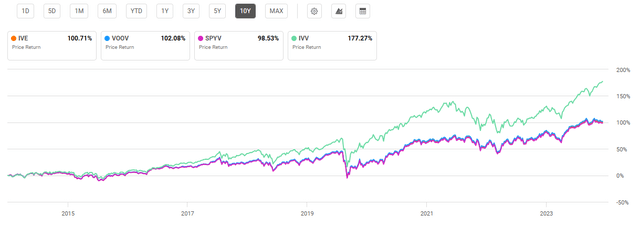
IVE has a 10-year average annual return of 10.44%. This performance is superior to peer Vanguard and SPDR funds with 10-year average annual returns of 9.76% and 10.09% respectively. IVV, which tracks the broader S&P 500 Index, has seen a considerably better performance with a 10-year average annual return of 12.92%. Although the broader S&P 500 fund has outperformed over the past decade, there are reasons to believe this will not always be the case, as I will discuss later.
10-Year Total Price Return: IVE and Compared S&P 500 Funds (Seeking Alpha)
A key drawback to IVE and peer S&P 500 value funds is their expense ratios relative to broader S&P 500 funds. At 0.18%, IVE’s fees are low but still not quite as low as IVV’s 0.03%. Additionally, most other S&P 500 funds such as the Vanguard S&P 500 ETF (VOO) also boast a low 0.03% expense ratio. As a redeeming quality, IVE does provide a dividend yield slightly higher than the market overall at 1.83%. Additionally, its dividend yield has been growing slightly higher than peer IVV at a 4.18% 5-year CAGR.
Expense Ratio, AUM, and Dividend Yield Comparison
|
IVE |
VOOV |
SPYV |
IVV |
|
|
Expense Ratio |
0.18% |
0.10% |
0.04% |
0.03% |
|
AUM |
$32.74B |
$4.88B |
$21.43B |
$497.18B |
|
Dividend Yield TTM |
1.83% |
1.91% |
2.00% |
1.30% |
|
Dividend Growth 5 YR CAGR |
4.18% |
4.85% |
3.52% |
3.86% |
Source: Seeking Alpha, 3 Jul 24
IVE Holdings and Key Consideration Factors
Due to IVE’s tracked index, the fund has almost identical holdings to peer S&P 500 value funds. As a result, its top similar holdings include Berkshire Hathaway Inc. (BRK.B), JPMorgan Chase & Co. (JPM), and Exxon Mobil Corporation (XOM). Because of IVE’s value focus, big tech is notably absent from the fund. In contrast, IVV has a comparatively heavy weight on Microsoft Corporation (MSFT), Apple Inc. (AAPL), and NVIDIA Corporation (NVDA).
Top 10 Holdings for IVE and Compared ETFs
|
IVE – 438 holdings |
VOOV – 441 holdings |
SPYV – 438 holdings |
IVV – 503 holdings |
|
BRKB – 3.79% |
BRKB – 3.82% |
BRKB – 3.79% |
MSFT – 7.36% |
|
JPM – 3.09% |
JPM – 2.97% |
JPM – 3.09% |
AAPL – 6.85% |
|
XOM – 2.64% |
XOM – 2.68% |
XOM – 2.64% |
NVDA – 6.51% |
|
JNJ – 1.81% |
JNJ – 1.79% |
JNJ – 1.81% |
AMZN – 3.95% |
|
WMT – 1.50% |
UNH – 1.44% |
WMT – 1.50% |
META – 2.41% |
|
UNH – 1.46% |
CVX – 1.43% |
UNH – 1.46% |
GOOGL – 2.35% |
|
BAC – 1.43% |
WMT – 1.43% |
BAC – 1.43% |
GOOG – 1.97% |
|
CVX – 1.38% |
BAC – 1.40% |
CVX – 1.38% |
BRKB – 1.59% |
|
PG – 1.21% |
PG – 1.20% |
PG – 1.22% |
LLY – 1.56% |
|
COST – 1.14% |
WFC – 1.09% |
COST – 1.14% |
AVGO – 1.56% |
Source: Multiple, compiled by author on 3 Jul 24
Looking forward, there are several key consideration factors for S&P 500 value compared to the broader index. The first is the recent performance of growth companies, which has driven much of the S&P 500’s broader performance, compared to value companies. We can then contrast this recent performance with the historic, long-term perspective for value versus growth. Finally, we will then consider the volatility of the S&P 500 value compared to the broader index and the risk potential for value given the S&P 500’s historically high valuation currently.
Consideration Factor #1: The Long Run for Growth
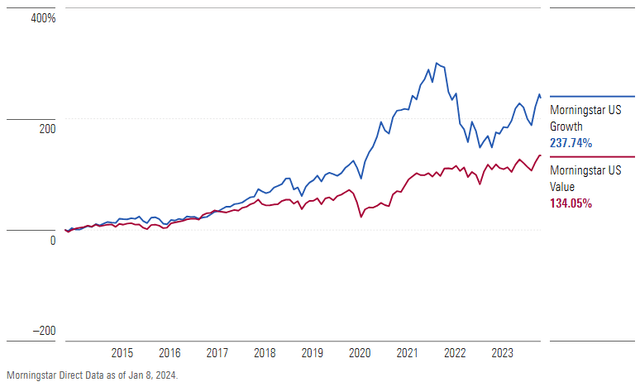
The first key consideration factor is the difference in performance between value and growth over the past 15 years. For example, between 2009 and 2015 the U.S. Federal Reserve lowered interest rates to a historically low level, fueling growth companies. Furthermore, COVID-related stimulus, technology-driven advances, and semiconductor demand following low supply also provided tailwinds for growth companies. These catalysts brought a spike in growth in 2020 and 2021 while value was considerably more muted. Looking further back, since roughly 2014, the Morningstar U.S. Growth Index has seen a return of over 237%. In contrast, Morningstar’s U.S. Value Index has only seen a 134% return.
Morningstar Growth vs. Value Indexes, 2014-Present (Morningstar Direct)
This stark difference in performance has presented a significant disparity. IVV’s market cap-weighted inclusion of the entire S&P 500 Index has resulted in a lopsided weight on information technology while the value funds are essentially the S&P 500 Index without big tech companies included. Looking back over the past 100 years, this recent disparity between value and growth is rare, though not unprecedented.
Consideration #2: Historic Context
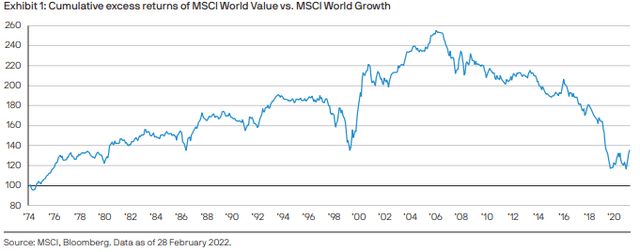
According to Fama and French data, between 1927 and 2019, value outperforms growth 93% of the time over rolling 15-year periods. The previous instances of this ratio of value to growth were seen back in 1999, 1987, and 1975. Interestingly, value saw strong returns in the immediate years following these instances.
Value vs. Growth Disparity Since 1974 (MSCI, Bloomberg)
This disparity between value and growth can be further seen in the price-to-earnings ratios of top holdings. Looking at P/E ratios over the trailing 12 months, we see values of 39.8, 34.3, and 71.6 for Microsoft, Apple, and NVIDIA respectively. This represents a clear distinction compared to the P/E ratios for Berkshire Hathaway, JPMorgan, and Exxon Mobil at 12.0, 12.6, and 14.0 respectively. This disparity not only points toward strong performance for value ahead, as seen historically, but also leads to a significant difference in the overall P/E ratios for each fund as discussed later.
Consideration #3: Performance during downturns
The third key consideration is the performance of S&P 500 value funds during downturns in the overall market. During the sharp downturn of 2022, IVV saw a decline of -17%. In contrast, IVE saw a much more benign -5.7%. Quantifiably, we can measure this volatility by looking at IVE’s beta value and standard deviation. IVE has a 3-year beta value of 0.86 and a 3-year standard deviation of 16.70%. Comparatively, IVV has a 3-year standard deviation of 17.81%. Because IVV captures the entire S&P 500, the fund has a beta value of 1.0. I have written multiple times previously that I believe the market is due for a correction. Valuations for the S&P 500 are significantly higher than their historic averages. This can be seen with the cyclically adjusted P/E ratio of the S&P 500 among other indicators. Therefore, I anticipate the next correction or bear market to have a particularly outsized effect on broader S&P 500 funds compared to value funds.
Current Valuation
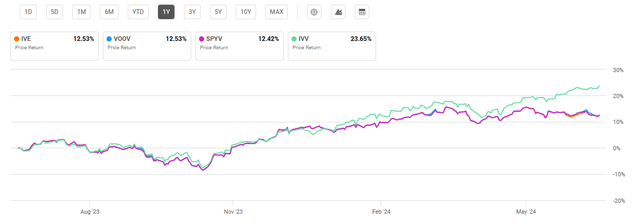
Since the start of the year, the S&P 500 has seen an impressive 16% return. IVE, by comparison, has seen a YTD return of just 3.6%. Therefore, 2024 so far has been in line with the longer trend we have seen for the past 16 years. However, this underperformance for IVE has resulted in a relatively more attractive valuation compared to the broader S&P 500 Index.
One-Year Performance: IVE and Compared ETFs (Seeking Alpha)
Examining price-to-earnings and price-to-book ratios for each fund, we see that IVE is roughly on par compared to peer VOOV and SPYV funds. However, IVV’s heavier weight in the IT sector has resulted in a P/E of over 27. It is worth mentioning that the median P/E ratio for the S&P 500 from 2003 to 2021 ranged between 12.5 and 23.6. Therefore, I believe a return to the S&P 500’s mean is likely in the coming years. By comparison, the value’s underperformance will arguably offer increased protection in the event of correction or bear market.
Valuation Metrics for IVE and Peer Competitors
|
IVE |
VOOV |
SPYV |
IVV |
|
|
P/E ratio |
18.97 |
20.00 |
16.74 |
27.36 |
|
P/B ratio |
2.62 |
2.70 |
2.63 |
4.79 |
Source: Compiled by Author from Multiple Sources, 3 Jul 24
Risks to Investors
Despite IVE’s lower P/E and the strong history of value compared to growth, IVE is not impervious to declines. For example, in 2008 the fund saw an even steeper drawdown than the broader S&P 500. During the Great Recession, IVV saw a decline of roughly 40% while IVE saw a drop of roughly 46%. Therefore, while IVE and peer value funds have seemingly better valuations, value companies are not necessarily shielded in downturns.
The second key risk is that I am fundamentally wrong. Could it be possible that there is an ultimate shift in value versus growth that disrupts the historic trend going back almost 100 years? Yes, it is possible. However, I believe it is unlikely. This is due to the disparity in valuations as well as historical trends when this disparity exists. As shown, large differences between growth versus value tend to correct. While the timing of this correction is almost impossible to predict, I believe it will happen again.
Concluding Summary
Despite IVE’s relatively weak performance compared to the broader S&P 500, there are reasons to be optimistic about S&P 500 value. First, mega-cap big tech companies have fueled growth within the broader S&P 500 Index resulting in historically high valuations. By comparison, IVE and peer S&P 500 value funds are comparatively more attractive. The current ratio between growth and value has historically meant that a correction is coming that drives relative strength in value companies within the S&P 500.
